

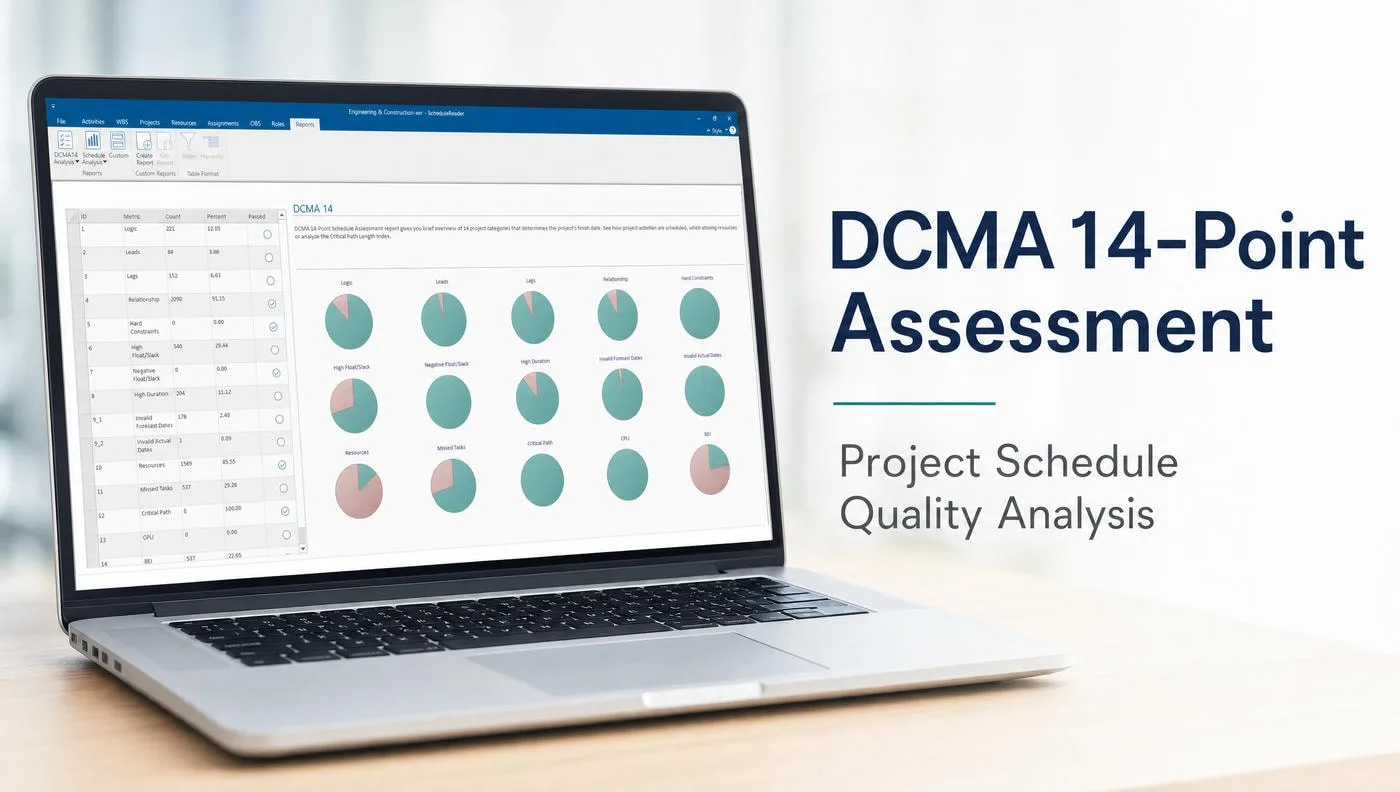
What is the DCMA 14-Point Assessment?
DCMA 14-point Schedule Assessment is a project management guideline established on 14 metrics that provide the possibility to make a qualitative and quantitative evaluation of the schedule. It is a handbook developed by the Defense Contract Management Agency (DCMA) for the purposes of the defense industry.
Unlike other schedule audits, the DCMA 14-Point Assessment gives you a numeric pass/fail on each of 14 criteria — from logic integrity to baseline execution risk. A schedule that passes all 14 is considered foundational for Earned Value Management (EVM) and aligns with GAO and DECM standards.
Making an assessment of the schedule is essential for the phases of planning, monitoring, and controlling. Therefore, these points are crucial for the health of the project schedule as they allow identifying and analyzing areas that are critical and can potentially create issues and obstruct the schedule.
Schedule quality? Run DCMA 14 in one click.
ScheduleReader PRO runs all 14 DCMA metrics and shows them on a single page. Logic, leads, lags, float, constraints. Pass or fail, you see it at a glance. No P6 license required.
- One-page dashboard
- Works with XER and XML exports
Key Takeaways
- The DCMA 14-Point Assessment evaluates schedule health across 14 criteria
- Each metric has a specific formula and pass/fail threshold
- ScheduleReader PRO runs all 14 checks automatically on any Primavera P6 .XER file
Which are the 14 metrics of the DCMA 14-Point Assessment?
DCMA 14-point Schedule Assessment set of criteria was formed in 2005 and firstly it was used by the US Department of Defense. Since then it had become a guideline for schedule review which has been implemented in many project management software widely used in the aerospace and defense industry.
A schedule that successfully passes the DCMA 14-point assessment is foundational for accurate Earned Value Management (EVM). These metrics frequently align with other major compliance frameworks, including the GAO Schedule Assessment Guide and DECM (formerly EVAS) standards, ensuring cross-industry scheduling integrity.
The 14 metrics are not set as necessary rules or standards but more as measurable criteria that are advisable to be analyzed regularly during the planning, monitoring, and controlling of the project schedule. Particularly, they are intended to indicate potential problems in the project schedule and, in the end, to ensure that the project is managed towards success.

The metrics that need to be followed and examined are the following:
Logic — Are all tasks connected?
Calculation: (Incomplete Tasks Missing Logic / Total Incomplete Tasks) x 100.
Logic measures the percentage of incomplete tasks missing a predecessor or successor — called ‘dangling’ activities. The DCMA threshold is ≤5% of incomplete tasks.
The best practice for avoiding incompleteness of tasks is ensuring that every task has at least one finish-to-start or start-to-start relation as its predecessor and at least one finish-to-start or finish-to-finish as its successor. This metric is important in investigating how project tasks are connected to each other and in assuring that no incomplete tasks affect the project schedule negatively.
Level of Effort (LOE) tasks are typically excluded from this metric calculation.
Leads — Are tasks overlapping?
Calculation: (Incomplete Tasks with Leads / Total Incomplete Tasks) x 100.
Leads measures the percentage of tasks with a negative lag — overlap between a successor starting before its predecessor finishes. The DCMA threshold is 0%: no tasks should have negative lag.
The leads in the schedule should equal zero, therefore there shouldn’t be tasks with a negative lag between each other. If there is a part of the schedule, which could prove itself as a potential problem, the tasks in question should be decomposed into separate tasks. This metric can impede the critical path analysis, therefore it is preferable that is used within the limits.
Instead of utilizing negative lags, a best practice is to decompose the predecessor activity into two separate, sequential tasks. This maintains a transparent, forward-flowing critical path.
Lags — Are there gaps between dependent tasks?
Calculation: (Incomplete Tasks with Lags / Total Incomplete Tasks) x 100.
Lags measures the percentage of tasks with a positive lag — a gap between a predecessor finishing and its successor starting. The DCMA threshold is ≤5% of incomplete tasks.
The DCMA threshold for this metric is more flexible than the one for the Leads and it advises that the lags in the project schedule shouldn’t be greater than 5%. However, the excessive use of lags as well can cause an obstruction to the critical path analysis, therefore it is recommended that they are avoided. A good practice for this metric is to present activities with specific names rather than with an ‘X-days lag’.
To maintain schedule transparency, replace positive lags with specifically named non-resource activities, such as ‘Concrete Curing Time’ or ‘Stakeholder Review Period’.
Relationship Types — Are 90%+ finish-to-start?
Calculation: (Tasks with FS Relationships / Total Incomplete Tasks) x 100.
Relationship Types measures the percentage of tasks using finish-to-start (FS) logic — “Activity A must finish before Activity B can start.” The DCMA threshold is ≥90% FS relationships.
The finish-to-start relationship provides the most explicit presentation of the project schedule activities. The other types of relationships, which can be identified in a schedule, are finish-to-finish (FF), start-to-start (SS), and start-to-finish (SF). However, it is not recommendable for these to be used since they are harder to monitor and control.
Convert non-FS relationships (like SS or FF) to FS wherever possible by decomposing tasks into smaller, sequential steps to improve schedule predictability.
Hard Constraints — Are dates being forced?
Calculation: (Incomplete Tasks with Hard Constraints / Total Incomplete Tasks) x 100.
Hard Constraints measures the percentage of incomplete tasks with Mandatory Start or Mandatory Finish dates. DCMA allows ≤5% hard constraints; soft constraints (e.g. “Start On or Before”) are acceptable because they preserve logic-driven scheduling.
DCMA recommends 5% of the constraints used, be Hard Constraints because they can provoke problems in the schedule. Hard Constraints can prevent the schedule to be logic-driven and create negative lags. In other words, Hard Constraints should be avoided since they can obstruct the logic of flowing naturally. Soft Constraints, on the other hand, allow the schedule to be logic-driven and they are not critical to the schedule.
Replace Hard Constraints with Soft Constraints (like “Finish On or Before”) or, ideally, remove them entirely to let the network logic and durations drive the dates naturally.
High Float — Could tasks slip unnoticed?
Calculation: (Incomplete Tasks with Total Float > 44 Days / Total Incomplete Tasks) x 100.
High Float measures the percentage of incomplete tasks with total float exceeding 44 working days. DCMA threshold is ≤5% of tasks. Float above 44 days usually signals a missing successor — not schedule slack.
This metric represents the time (hours/days) that an activity can be delayed without affecting negatively the project milestones and/or the estimated time for project completion. A certain task with a total float that exceeds 44 working days could be a consequence of incomplete activities (predecessor/successor).
If a task genuinely requires high float, document the reason. Unjustified high float often indicates missing successor logic that needs to be tied off.
Negative Float — Is the schedule already overdue?
Calculation: (Incomplete Tasks with Total Float < 0 / Total Incomplete Tasks) x 100.
Negative Float measures whether any incomplete task has total float below zero — a clear sign the schedule is already overdue. DCMA threshold is 0%: no negative float is permitted without a documented mitigation plan.
DCMA threshold for this metric is zero, therefore it is required that regular checks and reviews of the project schedule are executed. The Negative Float, or Slack, should be avoided, and, if tasks with a large amount of negative float are noticed, they should be mitigated, or otherwise, the risk for a missing project or milestones deadlines could arise.
While the strict threshold is zero, unavoidable negative float should be immediately addressed with a documented schedule mitigation plan detailing how the delay will be absorbed.
High Duration — Are any tasks too long?
Calculation: (Incomplete Tasks with Duration > 44 Days / Total Incomplete Tasks) x 100.
High Duration measures the percentage of incomplete tasks lasting longer than 44 working days. DCMA threshold is ≤5% of tasks. Tasks above 44 days should be decomposed into smaller, trackable activities — unless they are long-lead procurement or Level of Effort items.
Breaking down activities allows them to be measurable and controllable. Tasks with high duration can create obstacles in the project schedule and progress and can deform the critical path.
Activities exceeding the 44-working-day threshold are generally acceptable if they are explicitly identified as long-lead procurement items or continuous Level of Effort (LOE) tasks.
Invalid Dates — Are any dates impossible?
Calculation: (Tasks with Invalid Dates / Total Incomplete Tasks) x 100.
Invalid Dates flags tasks with forecast dates in the past or actual dates in the future — both signal statusing errors. DCMA threshold is 0%: every invalid date must be corrected or documented before baseline execution.
‘Invalid dates’ is a very critical metric, therefore the goal is not to surpass 0%, i.e. tasks with invalid dates require documented mitigation or correction prior to baseline execution.
Filter your schedule for actual dates greater than the data date, or forecast dates less than the data date, and correct these statusing errors prior to running the audit.
Resources — Are tasks missing resources?
Calculation: (Incomplete Tasks Missing Resources / Total Incomplete Tasks) x 100.
Resources measures the percentage of incomplete tasks missing a resource assignment. While DCMA recommends full resource loading, schedules that use resources must hit ≤0% missing — milestones and LOE tasks are typically exempt.
However, for those who are using this metric DCMA asks to not exceed the limit of 0%, i.e. to assign at least one resource (labor, cost, and/equipment) to all activities included in the schedule so that a misbalance is avoided.
Milestones and LOE tasks are typically exempt from requiring resource loading.
Missed Tasks — Are tasks falling behind baseline?
Calculation: (Tasks with actual finish dates past baseline finish dates / Total baseline tasks planned to finish by the status date) x 100.
Missed Tasks measures the percentage of tasks with actual finish dates past their baseline finish dates. DCMA threshold is ≤5% — anything above signals poor planning, inadequate resourcing, or both.
The bad performance, i.e. the large amount of missed tasks can be a result of inadequate resourcing, poor planning, or else. Consequently, DCMA holds that the number in question shouldn’t exceed 5% and if it gets critical, proper plans for correction are needed.
Use a “Finish Date Variance < 0” filter against your baseline to quickly identify and document these tasks for your stakeholders.
Critical Path Test — Does the critical path hold?
Test Methodology: Add 600 days to the remaining duration of a single critical path task. If the project’s overall completion date does not equally extend by exactly 600 days, the test fails.
The Critical Path Test validates the integrity of the network logic. Add 600 days to a critical path task’s remaining duration — if the project completion date does not extend by exactly 600 days, broken logic exists (missing links or improper constraints).
The Critical Path Test is performed to inspect if these two numbers are proportional. In other words, if the project completion date is not delayed for the exact amount of added days (600 days), it means that somewhere in the schedule exists broken logic, which may be a result of missing predecessor and/or successor activities or inappropriate hard constraints. If this happens, it is imperative to execute an in-depth analysis of the project schedule.
When testing this in your native scheduling software (like Primavera P6), ensure you remove the 600-day extension immediately after running the recalculation and before finalizing the baseline or exporting the XER file. Note that Level of Effort (LOE) tasks are excluded when selecting an activity for this test.
CPLI — Can the project finish on time?
Calculation: (Critical Path Length + Total Float) / Critical Path Length.
CPLI measures how efficiently the project must perform to meet its deadlines. A CPLI of 1.00 means the schedule fits the remaining time; below 1.00 means the project is likely late; above 1.00 means there is margin.
It is preferable that the CPLI equals 1.00, which means that the project must be completed within the planned time. A CPLI that is below 1.00 indicates that the project is inefficient, while a CPLI that is above 1.00 shows that there is a schedule margin which means that the project may be finished earlier than planned.
What CPLI tells you: If CPLI < 1.0, the critical path is longer than the remaining time — your project is likely late. A CPLI of 1.0 or higher means the schedule still fits the deadline.
If your CPLI is below 1.00, review the critical path for overly conservative task durations or excessive constraints that can be optimized to pull the completion date back in line.
BEI — Is the team keeping pace?
Calculation: Total Tasks Completed / Total Tasks Planned to be Completed (Baseline).
BEI measures team productivity against the baseline: total tasks completed ÷ total tasks planned. A BEI of 1.00 means the team is on track; below 1.00 signals falling behind; above 1.00 means ahead of schedule.
Similarly, as for the Critical Path Length Index (CPLI), DCMA for the Baseline Execution Index (BEI) test, the acceptable limit is 1.00, which indicates that the project team is performing well and according to plan. When BEI surpasses 1.00 it suggests that the team is performing ahead of schedule, while when it falls behind 1.00 it means that it is behind schedule.
What BEI tells you: If BEI < 0.8, tasks are taking longer than planned — your schedule baseline may be too aggressive. If BEI > 1.2, the baseline is too conservative and underestimates actual performance.
Unlike most metrics, BEI does not exclude LOE tasks. A BEI below 1.00 is a primary indicator that the project execution rate is falling behind the baseline plan.
Download the DCMA 14 Checklist
Print-friendly PDF with all 14 metrics, formulas, thresholds, and pass/fail boxes.
Download Free PDF →
How to Identify and Resolve DCMA 14-Point Violations
While the DCMA 14-point assessment highlights schedule health, resolving these flags requires adjustments in the source scheduling software. Schedulers should utilize custom filters to isolate violations before finalizing the baseline.
For example, filtering for ‘Finish Date Variance < 0’ will instantly isolate Missed Tasks. Similarly, filtering for ‘Total Float > 44 days’ will highlight High Float activities for review.
Ensuring these parameters are corrected in the native environment guarantees a clean export for subsequent analysis and reporting.
What are the benefits of DCMA 14-Point Assessment
Although it is not considered an industry standard, DCMA 14 is a comprehensive set of guidelines for planning, managing, and controlling project plans.
DCMA 14 check-points guarantee many benefits for the project schedule. Some of those are the following:
- Provide the possibility for constant in-depth analysis of the schedule;
- Help to identify weak points in the schedule;
- Assist in designating potential problems around the project activities and in creating appropriate corrective plans;
- Assure that the project is managed and executed with success and on time.
DCMA 14 Schedule Assessment in ScheduleReader PRO
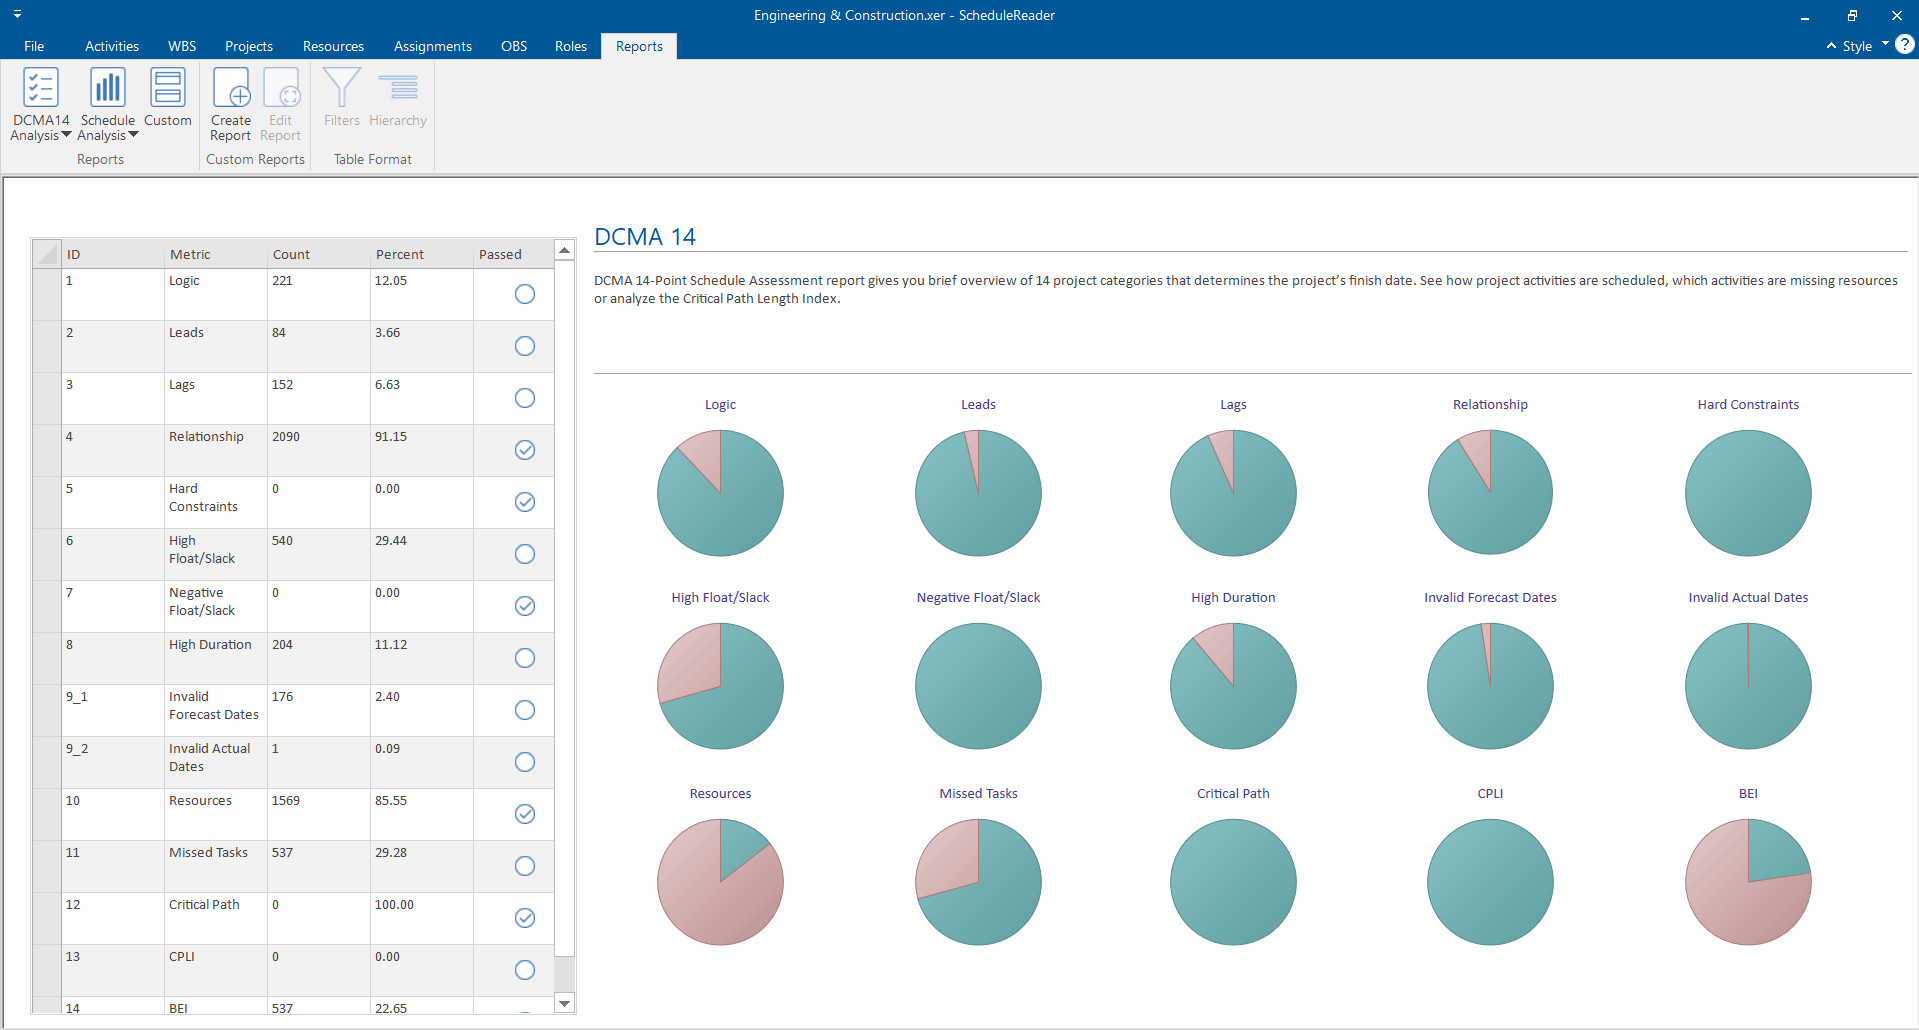
DCMA 14 Schedule Assessment in ScheduleReader PRO is presented as a one-page dashboard.
This functionality is designed to help users (Project Controls, Planners, Schedulers, Managers, Team Leads, Team Members, and Stakeholders who view the plans in PDF or XLS) to improve the process of scheduling exchanging information.
The DCMA feature allows measuring the project progress, communicating more effectively with the project team, and customizing the reports according to users’ preferences.
Moreover the DCMA 14 point assessment feature offers the three benefits that are crucial for achieving project success, which are:
- The scheduling information is presented in a clear and concise and it can be easily understood and absorbed by every project participant. In addition, PMOs can help to make business decisions in a reasonable time.
- DCMA 14 Schedule Assessment graphical reports are created with just one click. Additionally, the user can print the report for a management meeting or create more complicated reports and then export it and share with other project participants or team members;
- Report’s components are changed quickly by any project participant or team member and every report is customized with less effort.