

Project Data at Your Fingertips
Move beyond static PDF printouts. Experience your schedule data interactively.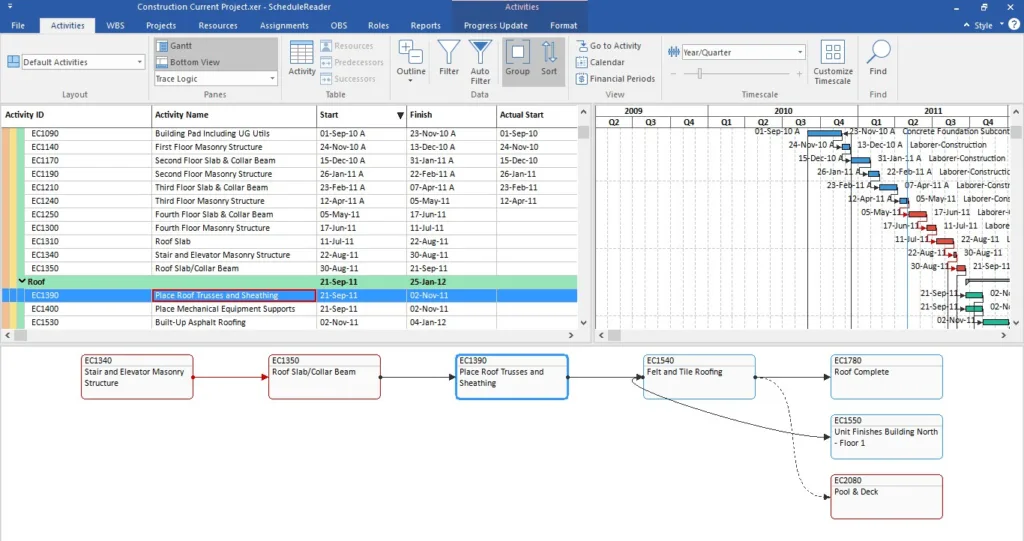
Interactive Schedule Overview
Get a full overview of your Primavera project data through dynamic views. Create personalized layouts, add or remove columns, and visualize relationships inside an elaborate Gantt chart. Plot data using histograms, stacked histograms, and S-curves to better understand trends, workload distribution, and project performance.
Easily track the critical path of your schedule. Navigate between driving activities and use the Trace Logic to visualize predecessor, successors, and understand dependencies without altering the original P6 file.
Progress Update: Two-way Collaboration
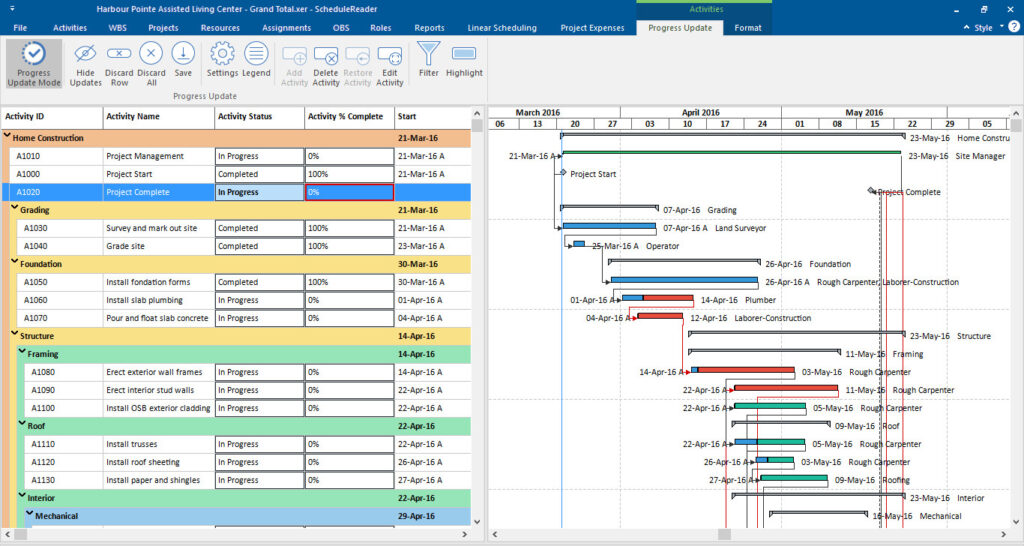
Bridge the gap between the office and the field. The Progress Update feature empowers on-site team members to propose activity status updates directly within ScheduleReader.
Schedulers receive these structured updates and can easily incorporate them back into Primavera P6, saving countless hours of manual data entry and email threading while maintaining strict control over the master schedule.
See how progress updates work →
Filtering, Analysis, Comparisons
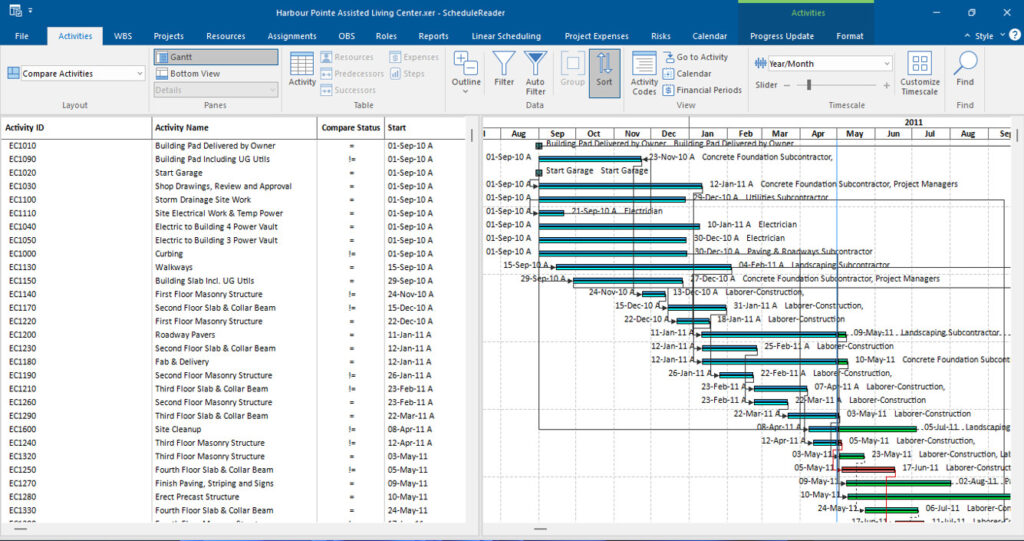
Use auto, custom and advanced filtering, sorts and grouping for faster schedule review, analysis and easily focusing on the activities, resources, or project areas that matter most. Compare baselines to identify changes, delays, and progress differences between versions.
Compare Projects (PRO feature): Perform a side-by-side analysis of two project plan with the same Project ID. Quickly detect any variances, delays, or improvements across activities, duration, and costs.
Learn about the Compare Projects feature →
Earned Value Analysis
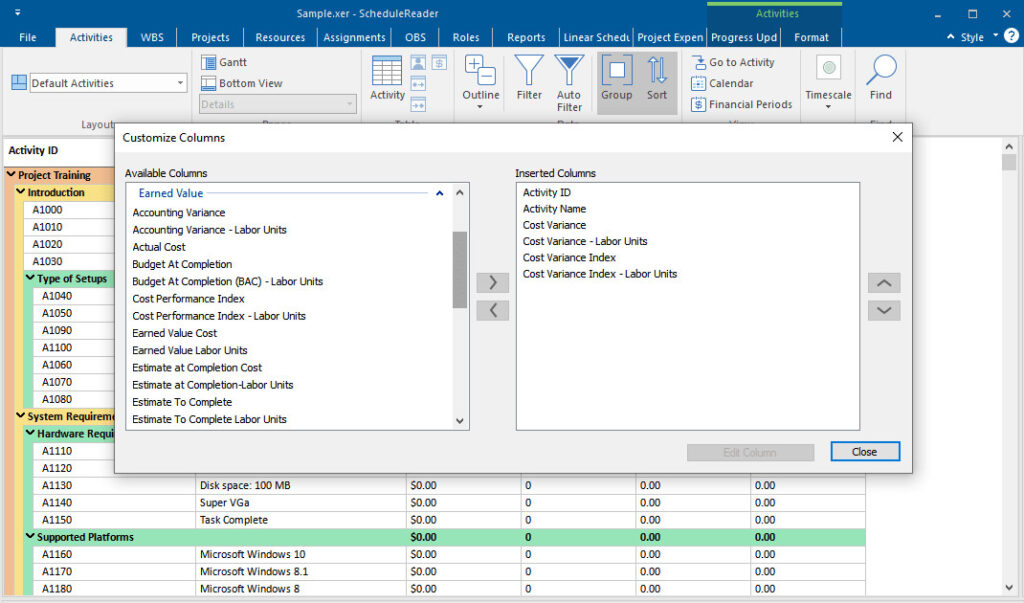
The earned value analysis provides the insights that helps project controls and managers pro-actively manage the project progress.
With ScheduleReader’s earned value analysis feature you can view the EV parameters from your schedule data and efficiently measure project performance and progress.
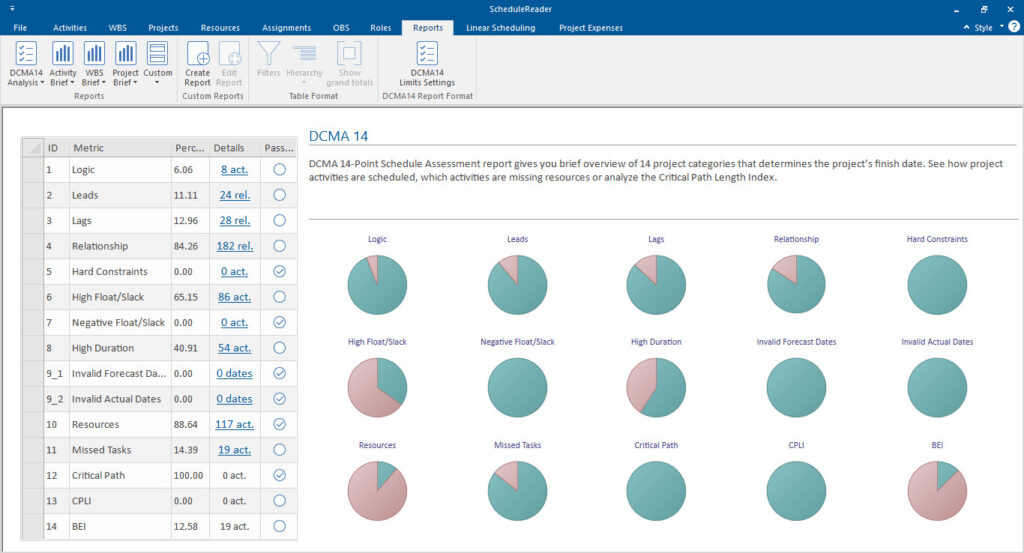
Dynamic Reports and Dashboards Including DCMA 14 Schedule Health Assessment PRO
Summarize key project information in clear, easy to understand visuals using the dynamic reports and dashboards.
ScheduleReader PRO also includes the built-in DCMA 14-point assessment, allowing you to instantly audit the quality of your project schedules.
Now you can quickly identify missing logic, excessive leads/lags, or hard constraints that could jeopardize your project’s success, all presented in a clean, visual dashboard format.
View details for the reports and dashboards →
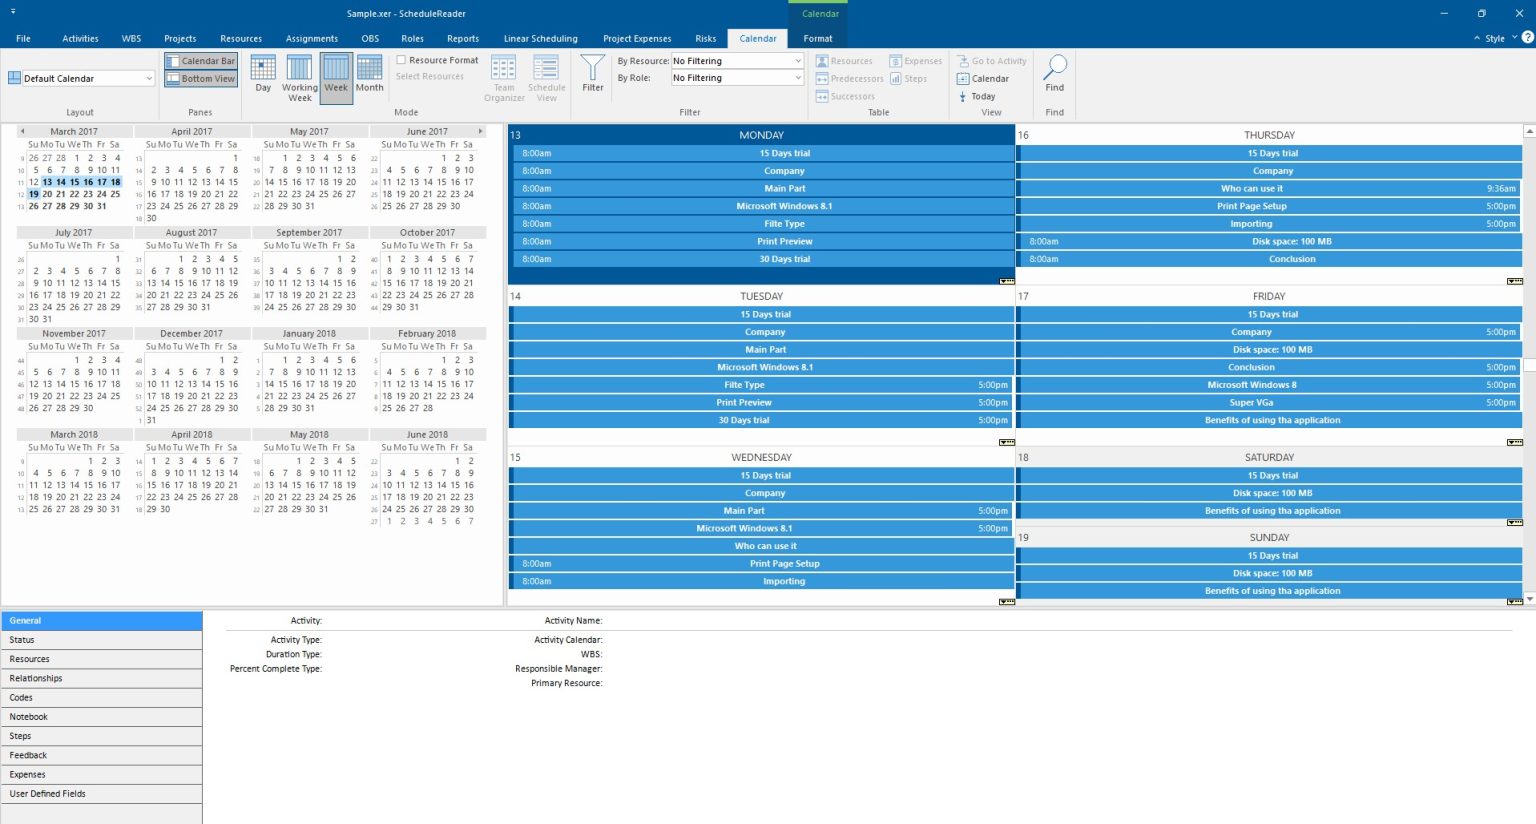
Calendar View for Field Teams PRO
While schedulers love Gantt charts, field engineers and foremen often prefer the simplicity of a calendar. The Calendar View provides an intuitive view of project data organized by days, weeks, or months.
This view is ideal for daily planning and on-site coordination, ensuring everyone knows exactly what activities are scheduled for the coming shift without needing to navigate complex timelines.
See calendar layout features →
Risks View PRO
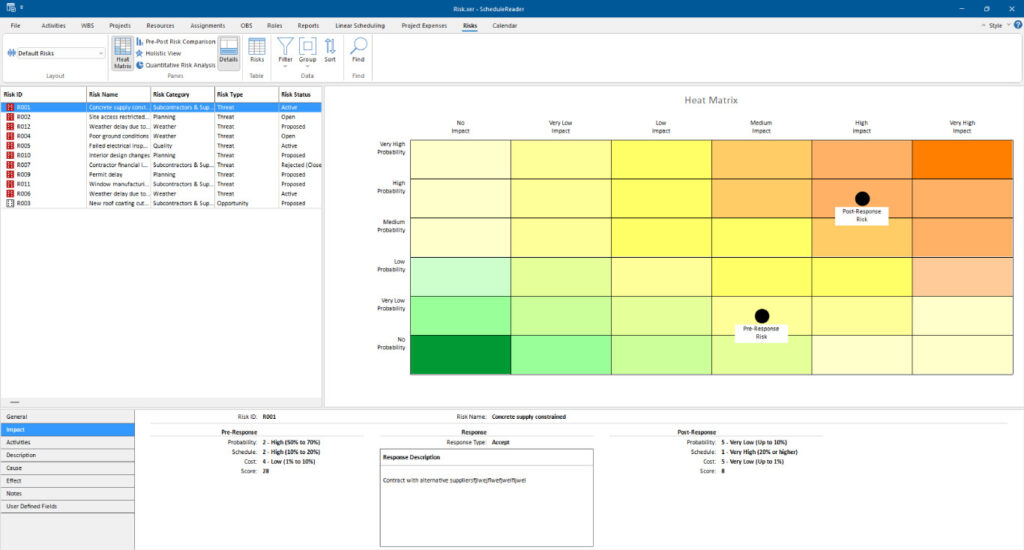
View detailed information about risks (and opportunities) assigned to the project, including risk name, impact, probability, and response strategies embedded in XER project plans.
The Risks view features built-in dashboards and charts that help with quantitative and qualitative risk analysis, including Heat Matrix, Pre-Post Comparison, Holistic View, Pie charts.
Dive into risk analysis charts →
Linear Scheduling View PRO
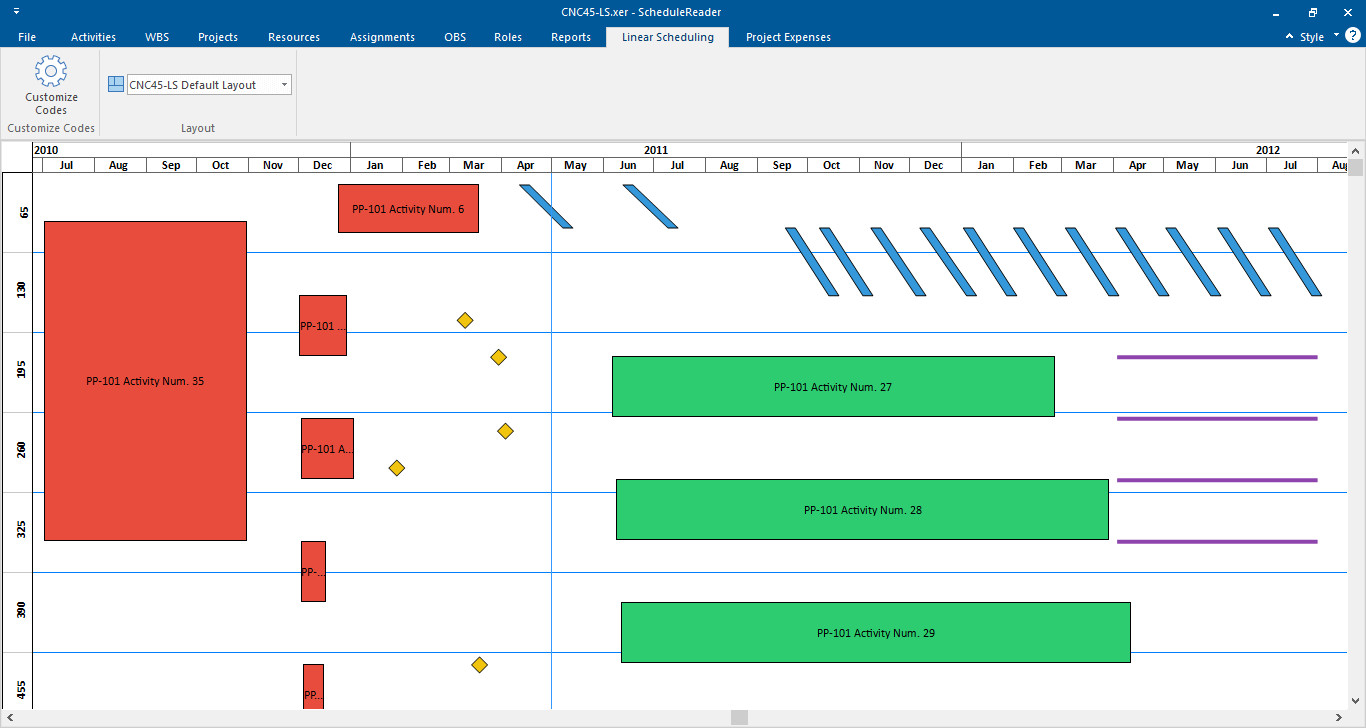
For infrastructure, rail, or pipeline projects, ScheduleReader PRO displays project data with Time-Location charts, providing a new context to the schedule timeline.
Activities are presented along a time/distance axis, in a single one-page view with geometrical shapes in different colors showing the occupation of the work site over time, such that conflicting access can be detected visually.
Explore time-location charts →
Engaged Teams, Efficient Projects
Why Choose ScheduleReader over PDF files
Open XER files in < 3 seconds
Load massive XER files instantly. No database connection required — it reads directly from the file.
Fraction of P6 Cost
Starting at $344/year vs. thousands for a P6 license. Give your entire team access to the schedule.
Read-Only Access
Your original schedule is never modified. Share with stakeholders without risking data integrity.