
Complete Schedule Visibility
Explore project data dynamically through multiple interactive views and understand schedules faster.

Explore the project data in your .xer schedules through dynamic, interactive views - WBS, activities, assignments, Gantt charts and S-curves - without modifying the original file.
The idea
A static report freezes one reading of the plan. An exported .xer file carries the whole dataset, so every reader can open the views they need, filter to their part of the work and follow the logic for themselves.
Explore project data dynamically through multiple interactive views and understand schedules faster.
Customize the work environment to match your needs, from columns and Gantt chart to saved views.
Move beyond static reports and spreadsheets and read the schedule where the detail lives.
What you get
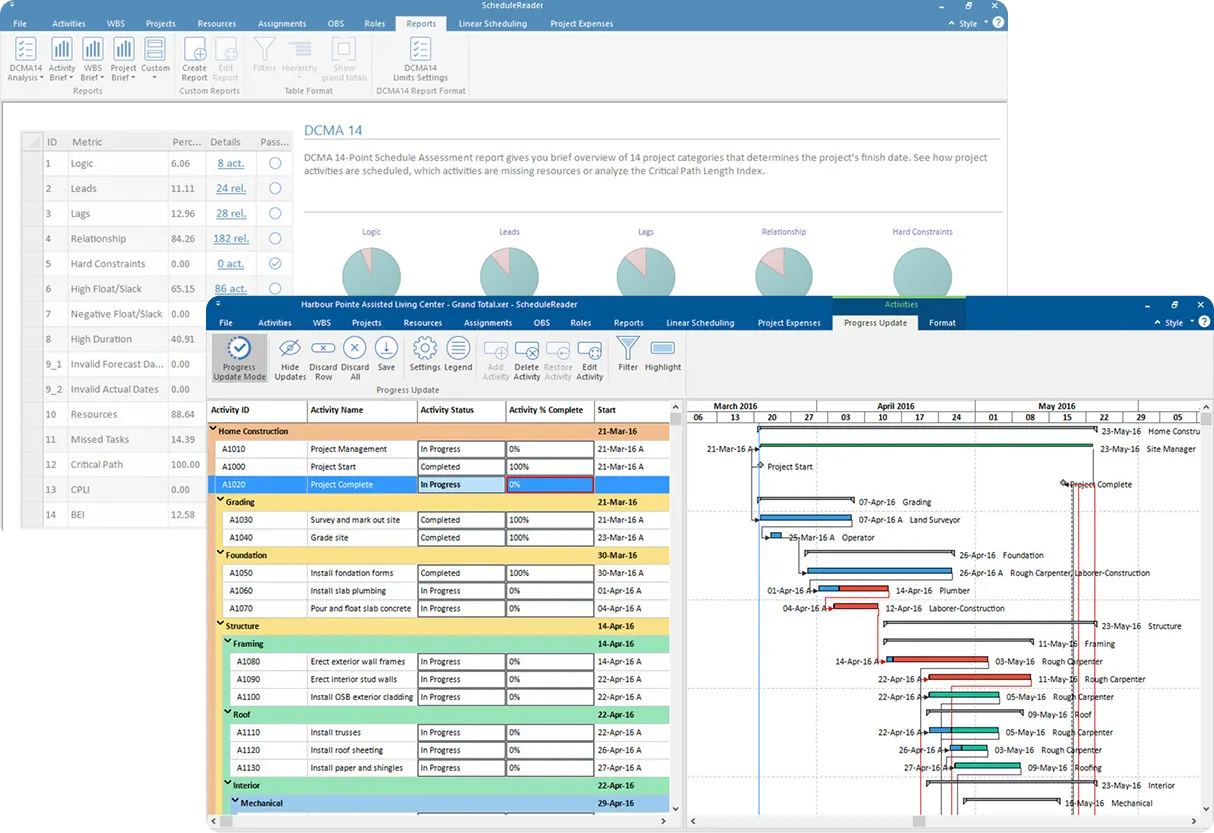
ScheduleReader gives you a full overview of the project data in your XER schedules through dynamic views. Explore the schedule, understand the project logic and see progress without modifying the original file.
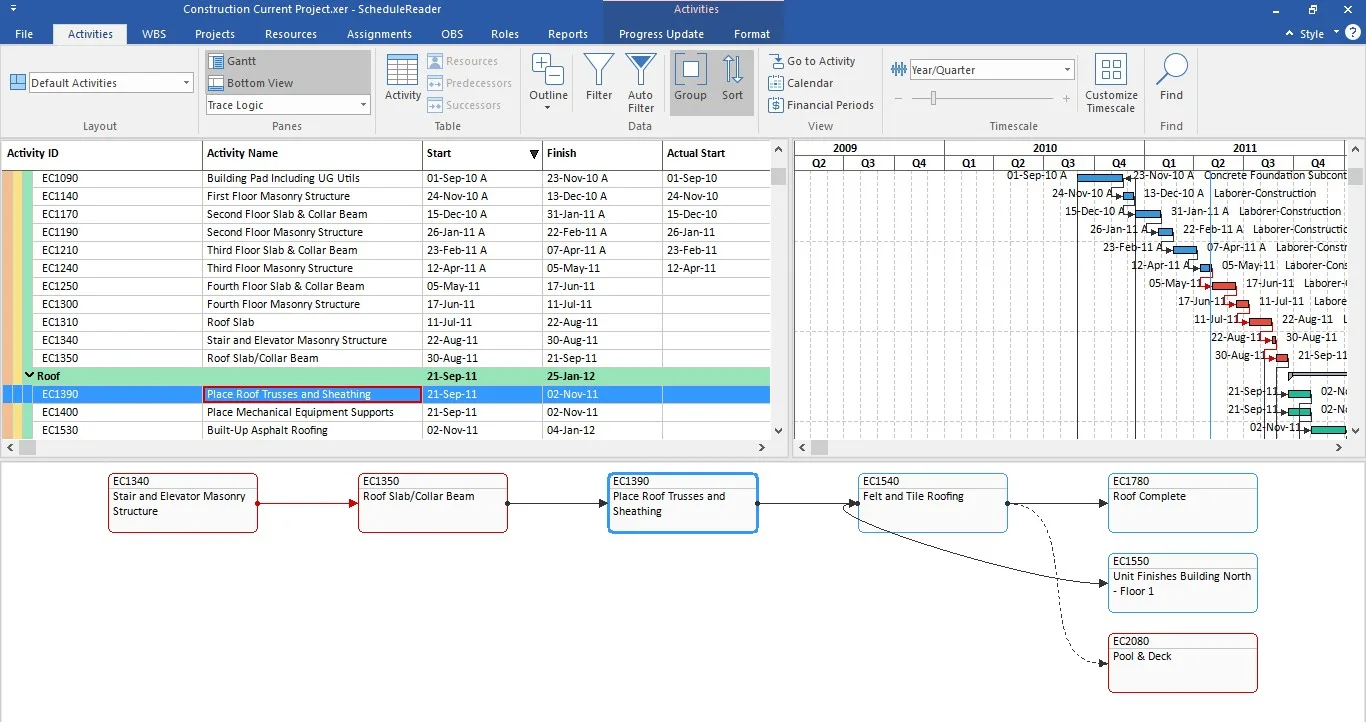
Identify and navigate the activities that directly affect project completion. Trace Logic shows how activities influence one another, without changing the original Primavera P6 schedule.
The views
Each view presents the schedule information in a clear, organized format, so planners, project managers, schedulers, consultants and stakeholders can find the detail they need.
Read the plan down the work breakdown structure, with rolled-up summaries and the activities that sit under them.
The full activity table and Gantt chart, where most schedule reviews happen.
Follow the resources and roles assigned to each activity, and the work planned against them.
Step back to the project level when several plans sit in the same file.
Read cost and financial period values carried inside the schedule.
Make it yours
Every project team works differently. ScheduleReader lets you customize layouts to display the data most relevant to your role, then save the view and reuse it.
Instead of adapting your workflow to the software, you tailor the software to your workflow. Related guides: create a new layout and manage layouts.
Charts
Raw schedule data only tells part of the story. ScheduleReader includes visual reporting tools that turn project information into meaningful insight.
Show the distribution of units or costs across time for the activities or resources you filter to.
Break a histogram into its parts, so you can see what makes up the total in each period.
Track cumulative progress across the life of the project and read the shape of the plan over time.
Combine both views to read period workload and cumulative progress side by side.
FAQ
No. ScheduleReader reads the exported .xer or P6 XML file directly, so a full project team can explore the schedule without a P6 license.
Create your own layouts with the columns, filters and grouping you need, or import layouts that were built elsewhere and continue in the same view of the data.
No. Every view is read-only. The original schedule file is opened as-is and is never modified.
Histograms, stacked histograms, S-curves and a combined histogram and S-curves view.
Yes. Save a custom view and reuse it, or share it with the rest of the team so everyone works in a standard environment.
Try it yourself
15 days, no obligation, nothing written back to Primavera P6.