
The “Financial periods” functionality helps project managers, team leads and other project participants to have complete overview of project performance for certain period of time. In order to have these financial periods available for viewing in ScheduleReader, project scheduler must create them in P6® and the values to be saved using the “Store Period Performance”.
Once the necessary operations are done in P6®, ScheduleReader users can see the project performance the predefined period in order to make resource allocation or units adjustments, if necessary.
Financial Periods in Activity View
How to view these parameters in ScheduleReader? Let’s have a simple example:
- Open .xer file that contains financial periods.
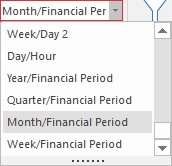
- To view the financial periods in the timescale, in the “Timescale” drop-down menu from the “Activity” ribbon, select one of the available options that is most appropriate for you work. In our case, we will select “Month/Financial Period”.
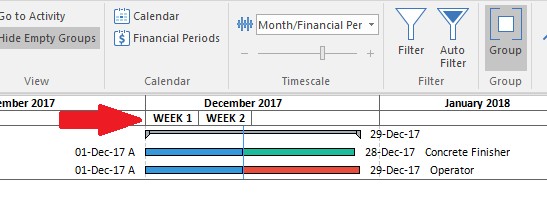
3. After performing this action, the project timescale will transform as the timescale presented on the image below.
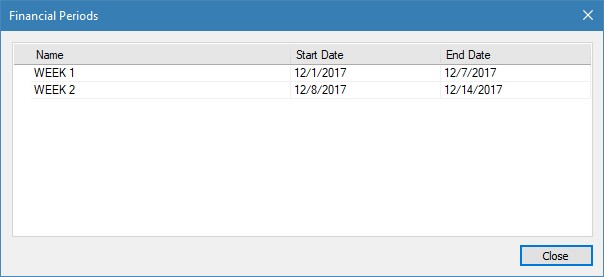
4. To view the financial periods that the project scheduler had created, along with the starting and finishing dates, select the “Financial Periods” feature, located in the “Calendar” group, within “Activities” ribbon.
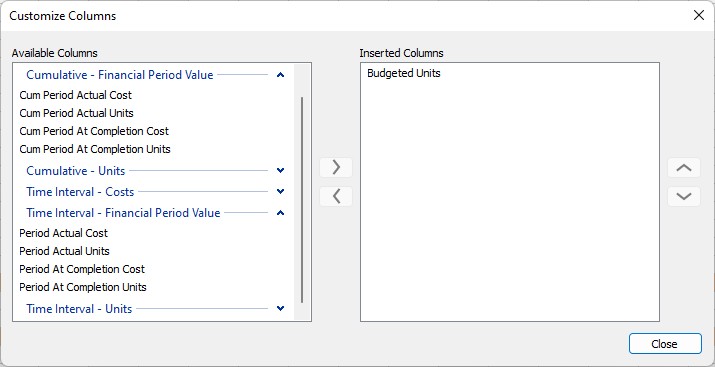
5. To view the values for the project’s performance over specific period, you need to insert the columns that contains the needed values. Open the “Activity Table” and from the “Financial Period Value” menu select the values for the specific period. For every specified period, the following values can be presented: Actual Expenses Cost, Actual Labor Cost, Actual Labor Units, Actual Material Cost, Actual Nonlabor Cost, Actual Nonlabor Units, Earned Value Cost, Earned Value Labor Units, Planned Value Cost and Planned Value Labor Units.
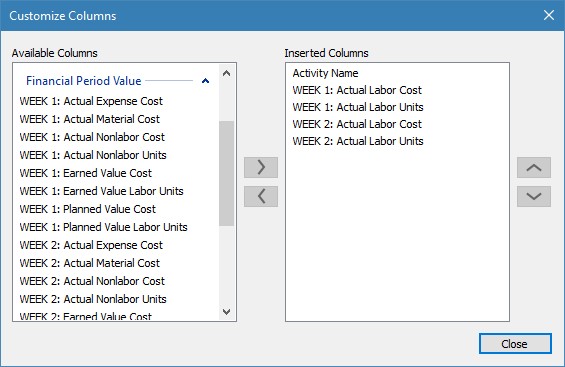
Note: To view these values in ScheduleReader™, project scheduler must saved them in Oracle® P6 using the “Store Period Performance” feature.
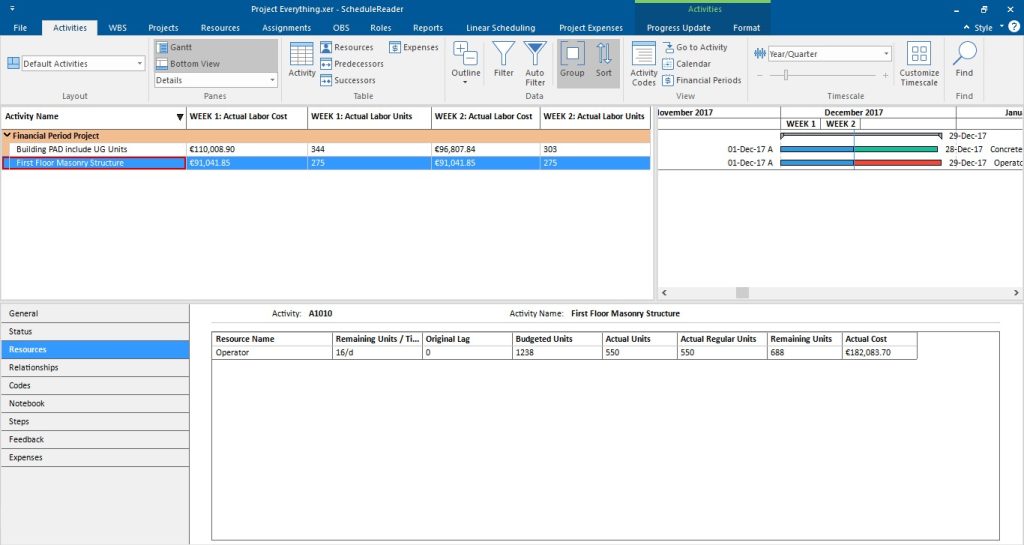
6. Finally, the “Financial Periods” layout is presented on the image below.
Another way to present the Financial Periods in the Activity view is the graphical display, through the function “Display Actuals using Financial Periods” which is located in the “Option” dialogs. For Activity Usage Profile/Resource Usage Profile view.
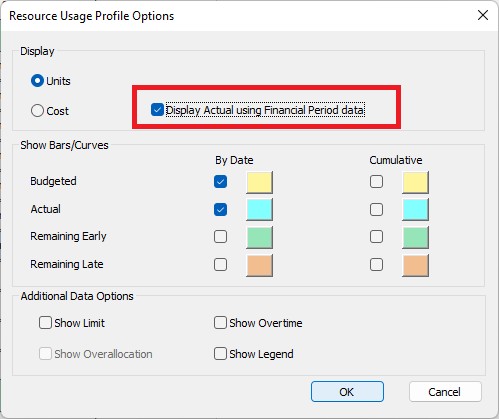
With a simple selection, the graphic chart will show the current values for costs and units that have been spent in the specific time periods.
Financial Periods in Assignments View
Depending on the needs of the user, the Financial Periods in the Assignment view can be displayed in 2 ways: in the Assignment table and in the Spreadsheet.
If the user wants to see a specific value for costs and units in a specific period, he should open the “Assignment table” and insert the necessary fields. Inside the dialog there is a special category named “Financial Period Value” that contains values for Costs and Units divided according to the periods specified in Oracle Primavera P6.
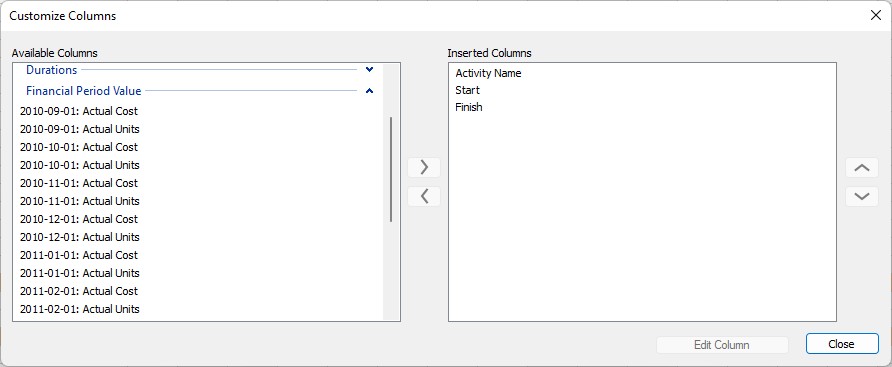
In case the user wants to see the financial periods in the assignment’s spreadsheet, the user should open the “Spreadsheet table” and insert the cumulative and/or actual fields. As in all dialogs in ScheduleReader, the values for the Financial Periods are stored in special categories inside the dialog.